Forecast calculations summary
The Forecast section of the Origin app allows you to view all the details about a forecast you added and perform various actions.
-
Click on a forecast’s name and the Forecast Calculations page will open.

-
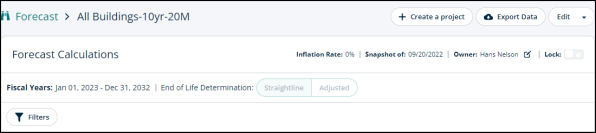
You can see the following information on top of this page:
-
Fiscal Years: Time duration for which the forecast has been made.
-
End of Life Determination: Two options here are:
-
Straightline
-
Adjusted
-
-
Inflation Rate: The current inflation rate according to the forecast budget.
-
Snapshot of: The date of the snapshot.
-
Owner: The person who added the forecast.
-
Lock: The lock toggle indicates if this forecast can be edited or updated.
-
-
Buttons on top
You can see three buttons on the top right corner:
-
Create a project: Use this button to create a project for assets with the same forecast.
-
Download: Click on this drop-down to download the forecast data as PDF or XLS file.
-
Edit: Use this button to edit the forecast you made or use the drop-down arrow to duplicate or merge.

Forecast tabs
Scrolling down this page, you’ll see three tabs:
-
Forecast Data
-
Forecast Graph
-
Forecast Simulation
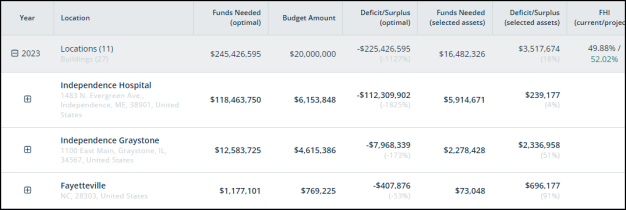
Forecast Data
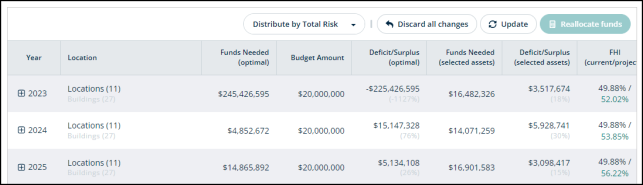
Switch to this tab to see the details of the forecast spanned over the duration of fiscal years.
-
The categories here are:
-
Year
-
Location
-
Funds Needed (optimal)
-
Budget Amount
-
Deficit/Surplus (optimal)
-
Funds Needed (selected assets)
-
Deficit/Surplus (selected assets)
-
FHI (current/projected)
-
Buttons
You can see different buttons here:

Funds distribution drop-down menu
You can click on this drop-down menu to see different options for distributing funds:
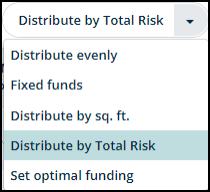
Here's a brief description of all these funds distribution options:
-
Distribute evenly: The total budget amount will be divided by the total number of fiscal years. For example, a budget of 10M for 5 years will be evenly distributed as 2M per year.
-
Fixed funds: The fixed budget amount allotted per year over the lifespan of a forecast.
-
Distribute by sq. ft.: The funds will be divided by the total square footage of the forecast and distributed as a cost per square foot.
-
Distribute by Total Risk: The funds allotted to prioritize the assets with the highest risk scores. This includes the assets that need immediate repairs and have no redundancy available.
-
Set optimal funding: Choosing this option will set the ideally required funds per year throughout the forecast's lifetime.
For example, optimal funds required for 4 years= 300,000,000
-
Year 1
-
Optimal funds = 100,000,000 and forecasted funds = 100,000,000
-
-
Year 2
-
Optimal funds = 50,000,000 and forecasted funds = 50,000,000
-
-
Year 3
-
Optimal funds = 50,000,000 and forecasted funds = 50,000,000
-
-
Year 4
-
Optimal funds = 100,000,000 and forecasted funds = 100,000,000
-
-
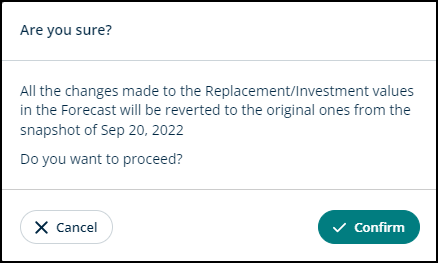
Discard all changes
Use this button to discard the changes you made to this forecast. Clicking on this button will open a confirmation message. Click Confirm to proceed or Cancel to go back.
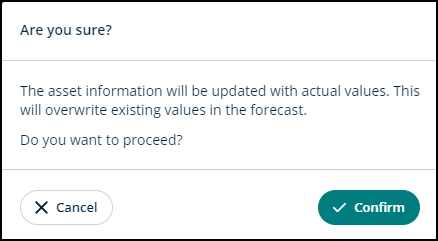
Update
Click on this button to update the asset information with actual values and overwrite existing values. A confirmation modal will open. Click Confirm to proceed or Cancel to go back.
Reallocate funds
Use this button to leverage Origin's funds distribution system. There are multiple options available to better fit your needs:
-
You can allocate the funds by year.
-
You can repurpose the funding from year 1 to year 2.
-
You can unselect assets from a specific year and again select them for a different year.
Expandable sections
-
In the Year column, you can see the + icon next to the year. Click on it to reveal all the locations for which this forecast was made.
-
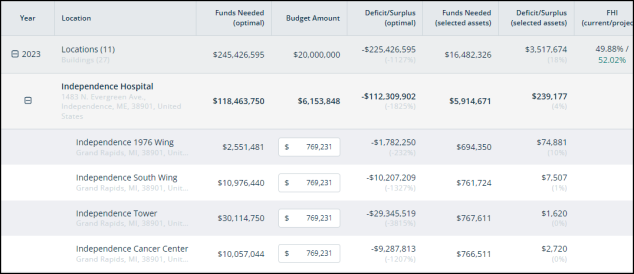
You can further reveal each location by clicking the + icon next to it.
-
You can see different areas of the building and different amounts of funds allocated in each category.
-
-
You can see the grand total amount by the end of this forecast.

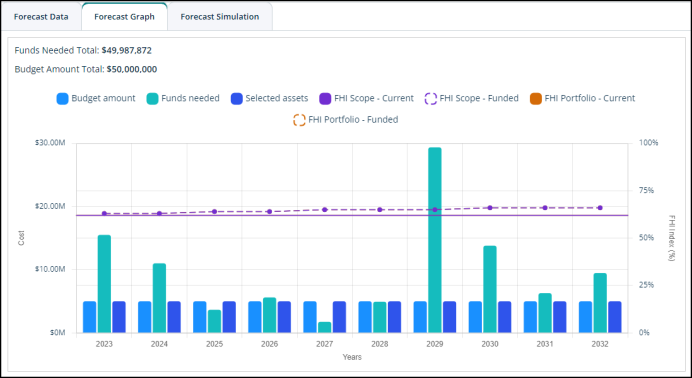
Forecast Graph
Switch to this tab and see the forecast data presented in a bar graph. You'll be able to visualize different variables and their impact categorized by year.
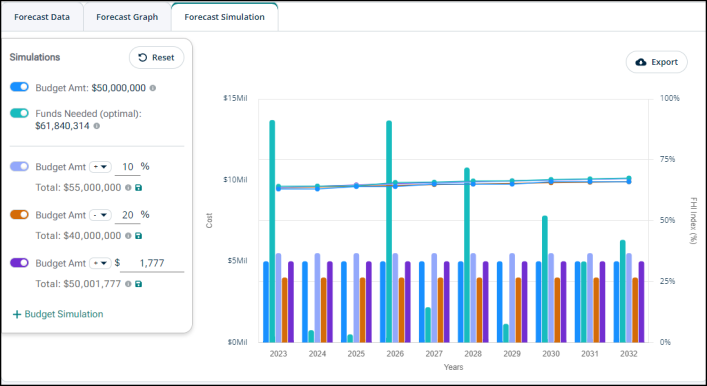
Forecast Simulation
Switch to this tab to manipulate the forecast data. You can turn the toggle next to different variables on or off and see the outcome presented in the graph bar next to it.
-
Click on + Budget Simulation to add the variable you want to test out.
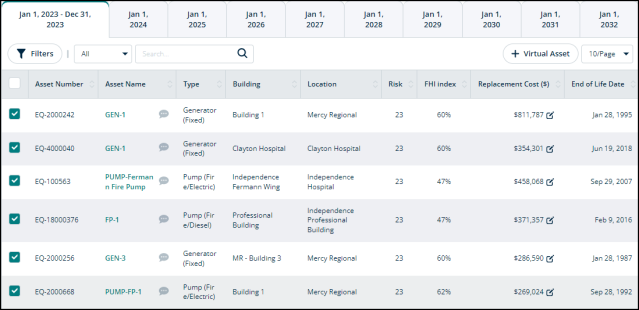
Forecasts categorized by year
By the end of this page, you’ll see the forecasts categorized by each year in individual tabs. For example, if you want to see the forecasts for the year 2030, you can switch to the tab named Jan 1, 2030 – Dec 31, 2030.
-
You can see information about:
-
Asset Number
-
Asset Name
-
Type
-
Building
-
Location
-
Risk
-
FHI index
-
Replacement Cost ($)
-
End of Life Date
-
-
The asset names are click-able and will direct you to Assets > General > Asset Name.
-
You can also add a comment about an asset using the bubble icon next to each asset’s name.

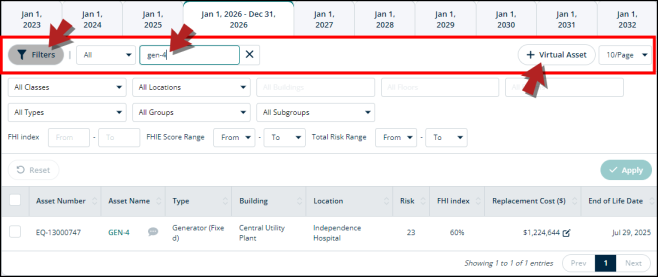
Buttons
-
Switch to any year’s tab and you’ll see a Filters button, a drop-down menu, and a search box on the left side.
-
You can use the + Virtual Asset button on the right side to add a new virtual asset.
-
The Filters button allows you to specify your search for a forecast by applying different filters.
-
You can use the search box to search for an asset by its name, number, type, building, and location.
-
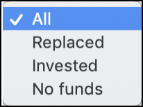
You can see a button with a drop-down arrow. Click on it to see the options available. Choose the option as required.